Graph
Section
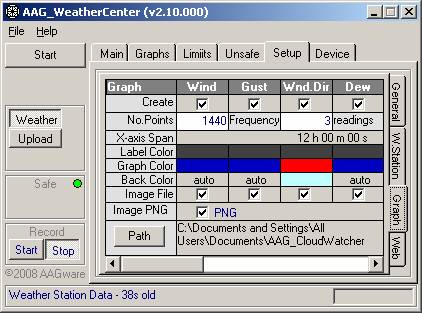
The Graph section of the Setup TAB allows the user to parameterize the graphs in terms of:
·
Create
flag when selected the respective graph is generated;
·
No.
Points defines the maximum number of points contained in each graph;
·
Frequency
defines the frequency with which the points are recorded in terms of number of
readings (one reading = one Calc.Cycle);
·
X-axis
Span displays the graph time coverage as a result of number of points * frequency * Calc.Cycle;
·
Label
color defines the graph’s labels color. NB: to change the color right click
with the mouse over the respective cell;
·
Graph
color defines the graph’s line color. NB: to change the color right click
with the mouse over the respective cell;
·
Back
color defines the graph’s background color. NB: except for auto, to change the color right click
with the mouse over the respective cell;
·
Image
file flag when selected the program creates an image file of the graph;
·
PNG
when selected image files of PNG type are created, otherwise the image files
are of JPG type;
· Path defines the path of the directory where the image files are created;
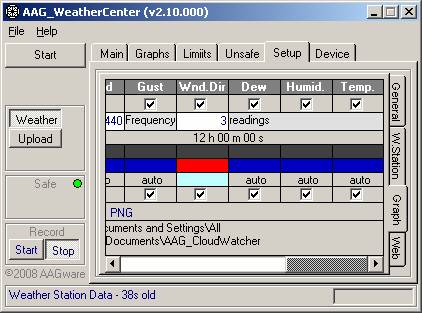
|
Note that this window has a horizontal scroll bar. |
|
|
|
|
|
|
|